Wattnet: Mapping the Carbon and Water Footprint of European Electricity in Real Time
Jaime Iglesias Blanco, María Castrillo Melguizo and Álvaro López García
Digital research infrastructures, supercomputers, cloud platforms, HTC clusters, and the networks that connect them are indispensable to modern science. They are also large consumers of electricity, and electricity is far from environmentally neutral.
The environmental intensity of electricity is not static. It varies continuously across time and space, driven by changes in generation mix, demand patterns, and cross-border power flows. Both the carbon emissions associated with generation and the water consumed in the process can differ dramatically from one moment to the next, and from one region to another.
Until recently, these dynamics were effectively invisible to researchers and infrastructure operators. Most decisions around compute scheduling, data processing, or model training have been made without visibility into the environmental conditions of the underlying power system.
Wattnet addresses this gap.
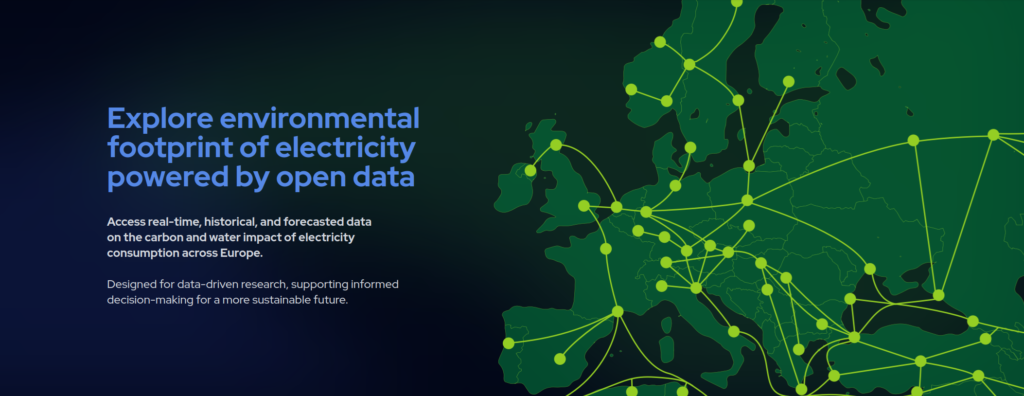
Developed within the GreenDIGIT Horizon Europe project, Wattnet is an open-source platform that provides real-time, historical, and forecasted data on the carbon footprint (CF) and water footprint (WF) of electricity consumption across Europe. The platform covers 60 grid zones at 15-minute resolution and includes forecasts up to 72 hours ahead.
Beyond the national mix: flow tracing across borders
A key methodological innovation in Wattnet is its electricity flow-tracing algorithm.
Traditional approaches estimate a country’s carbon intensity based solely on its domestic generation mix. This assumption breaks down in the European context, where electricity systems are deeply interconnected and cross-border exchanges are continuous and significant.
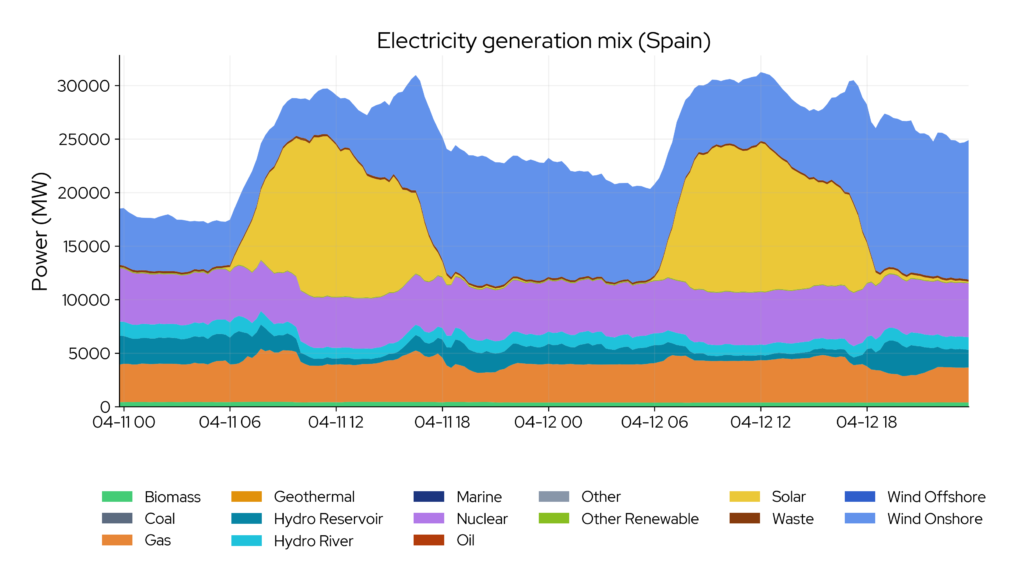
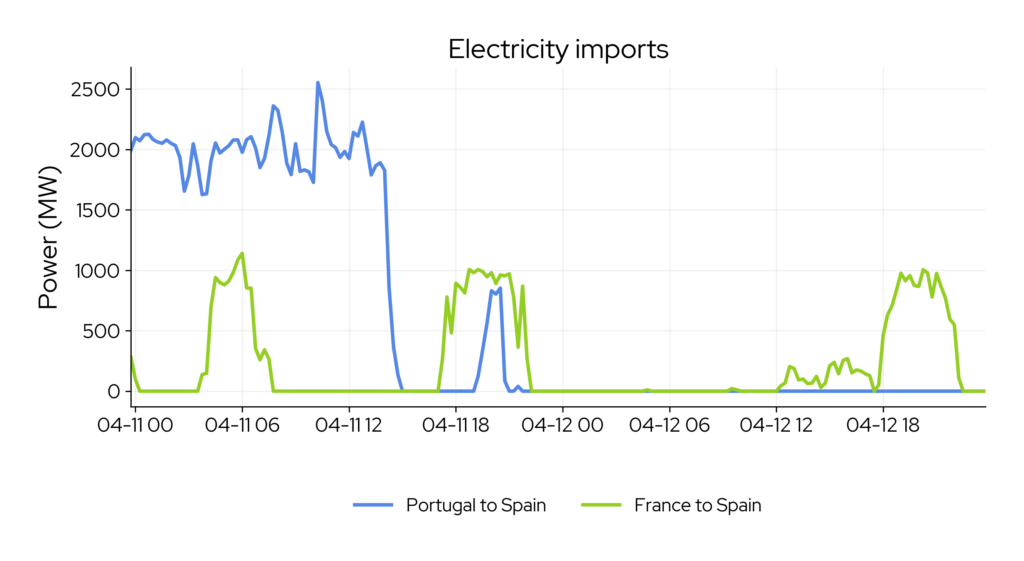
Figure: Spain’s electricity generation mix over 48 hours, together with cross-border power flows into the Spanish grid.
At any given moment, Spain imports electricity from France and Portugal, Germany exports to the Netherlands and Central Europe, and Scandinavian hydropower flows south through high-voltage interconnections.
As a result, the electricity consumed in a given zone is often produced only in part locally.
Wattnet explicitly models these flows. Its flow-tracing methodology attributes electricity consumption back to upstream generation sources across the entire interconnected system. This enables the computation of consumption-based carbon and water footprints, providing a substantially more accurate representation of environmental impact than production-based metrics alone.
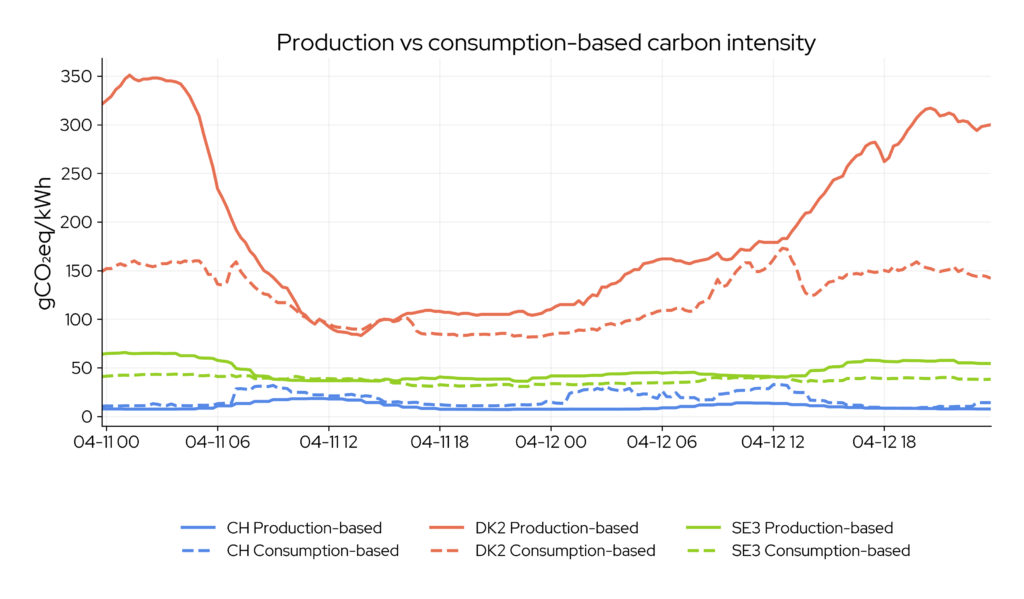
Figure: Differences between production-based and consumption-based carbon intensity in Switzerland, Eastern Denmark, and North-Central Sweden.
Two footprint perspectives: operational and life-cycle
Wattnet distinguishes between two complementary indicators.
The operational footprint captures direct emissions and water use from electricity generation at a given point in time. The life-cycle footprint accounts for full-chain impacts, including infrastructure construction, fuel extraction, and decommissioning.
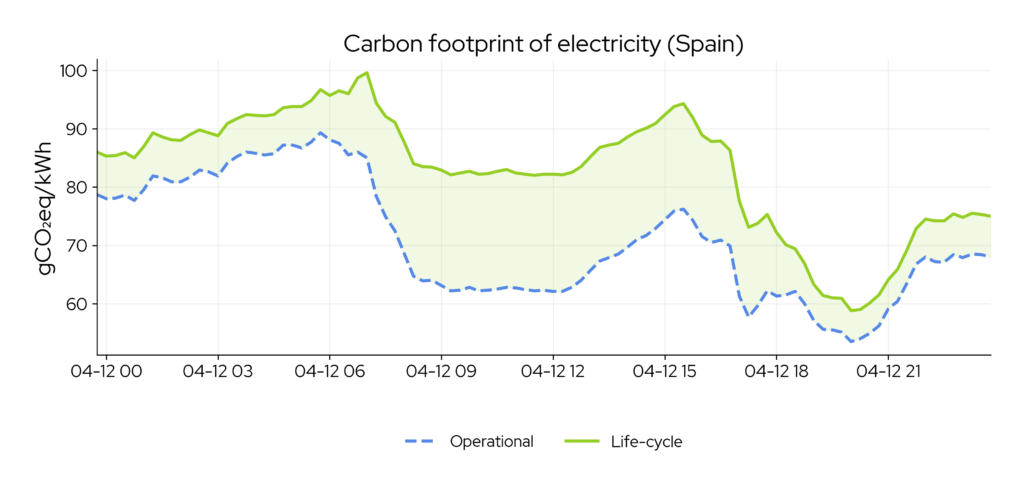
Figure: Operational and life-cycle carbon footprint of electricity consumption in Spain over time.
This dual perspective allows users to move beyond simplified metrics and engage with a more complete environmental accounting of electricity use.
From monitoring to decision-making: forecasting and workload scheduling
Wattnet is not only an observability platform, but it is also designed to enable action.
By providing 72-hour forecasts of CF and WF across all zones, the platform supports impact-aware workload scheduling. HPC schedulers, cloud orchestrators, and workflow managers can integrate environmental signals directly into their decision logic.
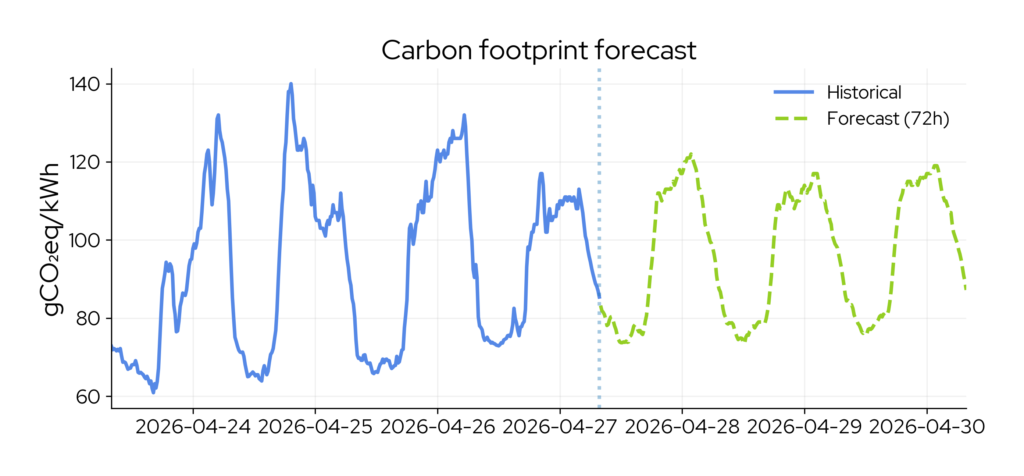
Figure: Short-term forecast of electricity generation and carbon footprint in Spain.
This makes it possible to shift flexible workloads to lower-impact time windows, geographically distribute computation based on grid conditions, and reduce emissions and water use without changing scientific outcomes.
In this context, environmental footprint becomes a controllable variable rather than a post-hoc metric.
Open data, open science
Wattnet integrates generation data, cross-border flows, and production-type breakdowns from open European energy datasets. These heterogeneous inputs are harmonised into a consistent, transparent data model.
All code and data are openly available. The public dashboard at dashboard.wattnet.eu provides an accessible interface for exploration, while the API enables integration into external systems and workflows.
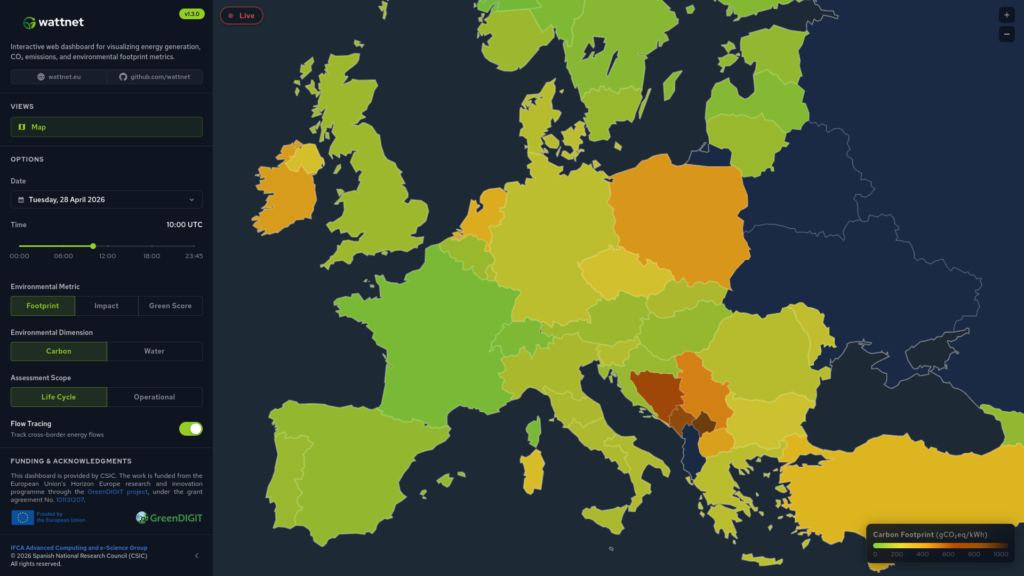
Figure: Screenshot from the Wattnet dashboard displaying real-time life-cycle carbon footprint of electricity consumption across European regions.
The platform is part of GreenDIGIT’s broader Common Information Model (CIM) ecosystem, designed to standardise environmental metrics across digital research infrastructures and enable federated sustainability monitoring at the European scale.
Towards environmentally-aware computing
Wattnet contributes to a broader shift in how digital infrastructures are operated. As compute demand continues to grow, particularly with the expansion of AI workloads, the ability to align computation with cleaner energy becomes increasingly critical.
By making the environmental dynamics of electricity visible, quantifiable, and actionable, Wattnet turns energy awareness into an operational capability.
If you’d like to explore Wattnet in greater depth, you can visit the product website at wattnet.eu, interact with the live dashboard at dashboard.wattnet.eu, review the actively developed open-source code on GitHub (github.com/wattnet), or consult the accompanying preprint and supporting materials available on Zenodo (DOI: 10.5281/zenodo.17404776).