
GreenDirector: greener computing on AI4EOSC and iMagine
Jaime Iglesias Blanco, Ignacio Heredia, Marta Obregón Ruiz and Álvaro López García
GreenDIGIT Project | October 2026
Every time a user deploys a model, an inference service, or a training job on AI4EOSC or iMagine, that workload has to run somewhere within the cloud federation. The federation spans multiple sites across Europe, each with its own hardware, its own energy efficiency, and its own local electricity mix. Until now, the scheduler chose where to place a deployment based on resource availability alone, without taking into account a key factor: the environmental impact of the energy powering each data centre.
That has just changed.

Background: a federated AI platform for the EOSC ecosystem
AI4EOSC is a federated, open-source platform for the full AI/ML lifecycle, covering everything from interactive model development and training to serverless deployment and monitoring, designed to operationalise open science practices within the European Open Science Cloud (EOSC), the European Commission initiative building a shared “web of FAIR data and services” for researchers across Europe. Access to the platform goes through the EOSC Authentication and Authorisation Infrastructure, so any institution already part of EOSC can log in with its own credentials. iMagine is one of the domain-specific gateways built on top of AI4EOSC’s shared infrastructure, tailored to the marine science community, alongside other gateways and projects that extend the same underlying platform to different scientific domains.

Underneath that platform sits a federation of cloud sites, each running its own OpenStack-based infrastructure and contributing compute capacity (CPU, GPU, and storage) to a common pool. Among the providers currently part of this federation are IISAS (Slovakia), TUBITAK (Turkey), and PSNC (Poland), together with IFCA and other partner sites, each with different hardware profiles, different energy efficiencies, and different local electricity grids.
When a user launches a deployment, the platform’s scheduler decides, behind the scenes, which of these sites will actually run it. Historically, that decision was based purely on technical criteria: which sites have free capacity, which ones meet the hardware requirements of the job (a specific GPU model, enough memory, and so on). GreenDirector adds a new criterion to that decision, one that has nothing to do with performance and everything to do with impact.
Introducing GreenDirector, powered by the GreenScore metric
Platforms based on AI4EOSC (AI4EOSC and iMagine) now include GreenDirector, a scheduling capability that decides which data centre in the federation each user deployment is sent to. Rather than treating “where a job runs” as a purely technical placement problem, GreenDirector folds environmental impact directly into that decision, guided by GreenScore, a new metric that combines three dimensions:
- Hardware resource efficiency: compute capacity per watt delivered by the CPU or GPU of each node, depending on what the workload actually requires.
- Site energy efficiency (PUE), i.e., how much additional energy a data centre consumes on top of what is used directly for compute: cooling, power distribution losses, and other overheads.
- Environmental quality of the electricity consumed in the zone where each site is located.
This third component is obtained from the Environmental Score of Wattnet, the platform developed within GreenDIGIT that tracks the carbon and water footprint of electricity across Europe in real time. The Environmental Score jointly combines the carbon footprint with the water impact: the water footprint of electricity generation weighted by the water scarcity of the zone where that water is drawn, so that the same volume of water counts for more in a water-stressed region than in a water-abundant one. Together, these form a single score reflecting the environmental quality of the energy in each grid zone.
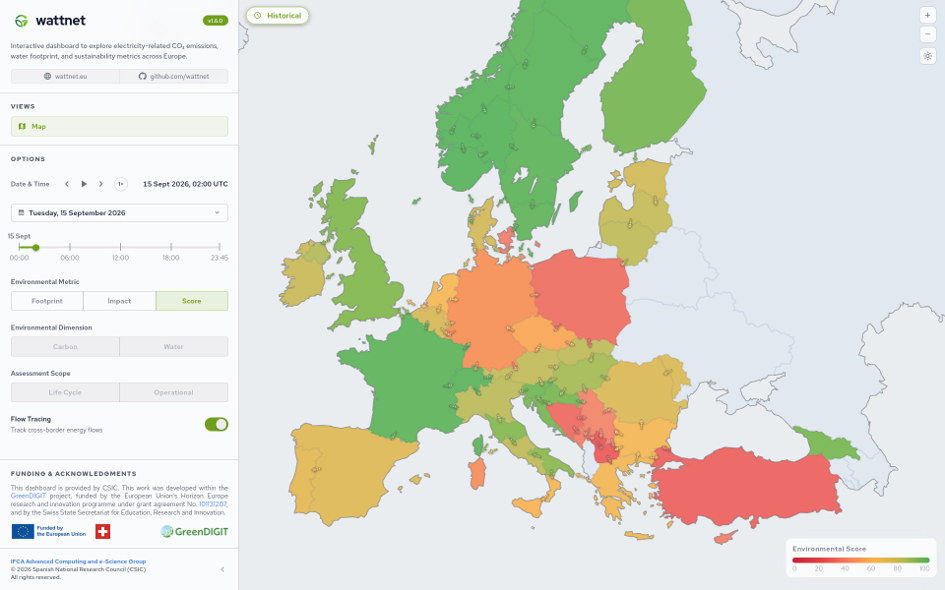
Figure: Screenshot of the Wattnet dashboard (dashboard.wattnet.eu), showing the Environmental Score metric for each zone on the map at a given timestamp. As shown in the legend, greener colours and higher values indicate a better score.
Bringing these three dimensions together means GreenScore does not just answer “which site is fastest or has capacity right now”, but “which site can run this job well and with the lowest environmental cost at this particular moment”, and GreenDirector acts on that answer. Since the environmental quality of the electricity can shift throughout the day, and Wattnet’s data is refreshed continuously, the same deployment could, in principle, be routed to different sites depending on when it is launched. A job submitted at midday in one country might land on a different, cleaner site than the same job submitted a few hours later. With GreenDirector, user deployments are now steered, whenever possible, towards the most environmentally friendly data centre in the federation at any given moment, with no change required to how users define or launch their jobs. The optimisation happens transparently in the scheduling layer, across sites like IISAS, TUBITAK, PSNC, and IFCA.
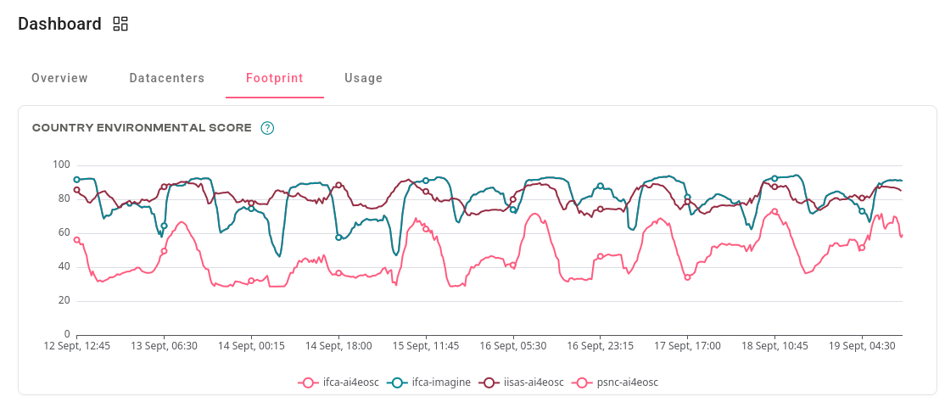
Figure: Environmental Score signal from Wattnet.eu collected for AI4EOSC/iMagine datacenters. The score ranges from 0 to 100 and represents how environmentally sustainable the electricity mix of a country’s power grid is.
Per-deployment energy monitoring (beta)
Knowing where a job runs is only half the picture; knowing how much it actually consumes is the other. In parallel to GreenDirector, energy monitoring at the individual deployment level has been launched in beta for jobs running on IFCA sites. The system measures the actual CPU and GPU consumption of each node, only while the job is actively running, rather than relying on static estimates based on requested resources. Crucially, this reporting happens in real time, while the job is still executing, rather than as a summary produced once it has finished.
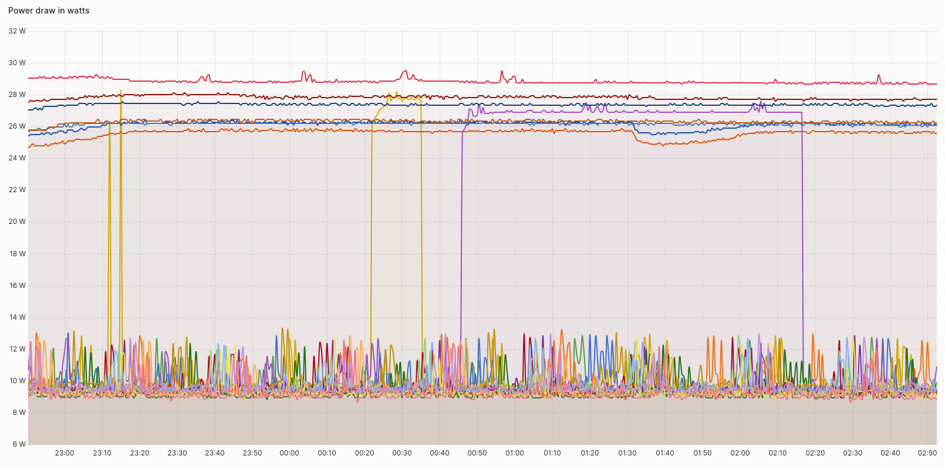
Figure: Power draw (in watts) of multiple GPUs hosted on the IFCA-AI4EOSC and IFCA-iMagine data centres, within the AI4EOSC federation.
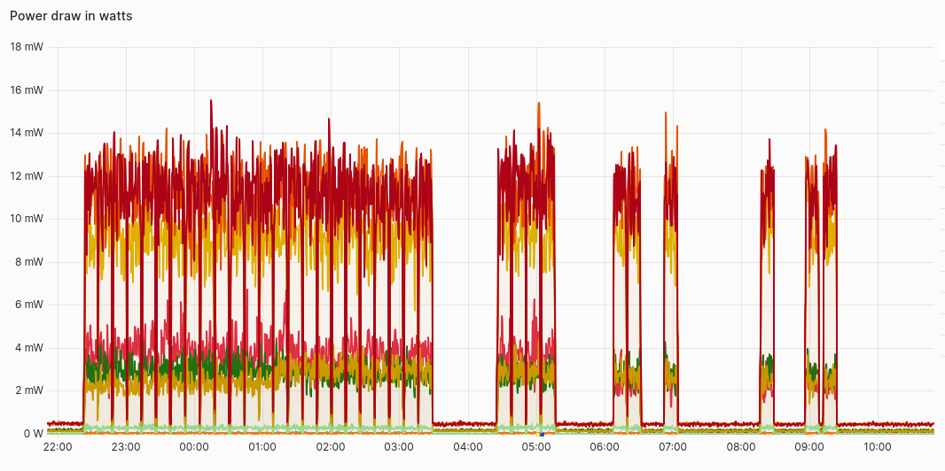
Figure: Power draw (in watts) of multiple workloads running on a compute node at the IFCA-AI4EOSC data centre, within the AI4EOSC Platform Federation.
This attribution is not trivial, and it happens on two layers at once. At the infrastructure level (IaaS), the physical hardware is virtualised into VMs, and those physical resources are shared with other VMs, including workloads entirely external to the platform. On top of that, at the platform level (PaaS), user deployments run as containers on those VMs, and a single VM is typically shared by several AI4EOSC users. So attributing energy consumption to a given deployment means splitting it out twice: once from the physical node down to the VM it belongs to, and again from that VM down to the specific container running the user’s job. Fairly splitting the real energy consumption at both levels requires an additional layer of instrumentation, in this case based on Scaphandre, that estimates the consumption attributable to each container or virtual machine, even though none of those layers can see the full picture on their own.
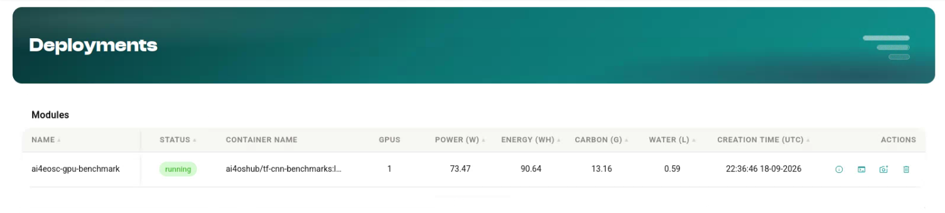
Figure: Screenshot from the dashboard.cloud.ai4eosc.eu deployments list page. Each deployment now displays its real-time power consumption, accumulated energy consumption, and carbon and water footprints since its start.
As a result, each user can now check in real time, for every one of their deployments, on the AI4EOSC dashboard:
- Instantaneous power
- Cumulative energy consumed since the job started running.
The carbon and water footprint associated with that consumption.
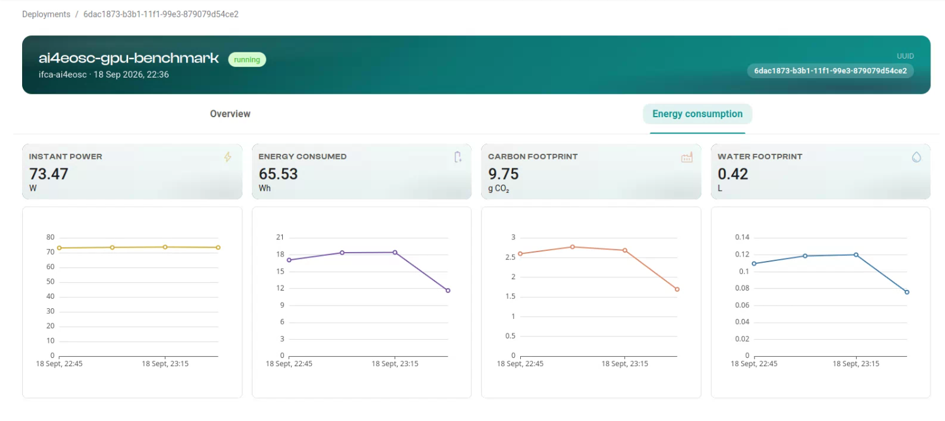
Figure: Screenshot from the dashboard.cloud.ai4eosc.eu deployment detail page. The page displays real-time power consumption, accumulated energy consumption, and carbon and water footprints, together with historical charts showing the evolution of these metrics over time.
This data can also be aggregated at the user level, offering an overall view of the environmental impact of all of a user’s activity on the platform, across all of their past and ongoing deployments, rather than having to inspect each job individually.
And at the infrastructure level too
Beyond the per-deployment view, the dashboard also provides the total energy, power, and environmental footprint of the platform, currently limited to IFCA sites. This global view includes the consumption of the whole infrastructure, whether or not jobs are running at any given moment: a data centre draws power continuously simply by being operational (networking, storage, idle nodes, cooling), and this view reflects that baseline, giving a more honest picture of the platform’s overall footprint than user-level figures alone could. Extending this platform-wide view to the rest of the federation’s sites is a natural next step as the monitoring approach matures.
Towards environmentally-aware computing
With GreenDirector and per-deployment energy monitoring, AI4EOSC and iMagine take a step towards a more transparent and responsible operation of the cloud infrastructure underpinning European science: the environmental impact of computation can now not only be measured, but also acted upon, by steering workloads towards the most environmentally friendly options available at any given time. Both developments build directly on the work carried out within GreenDIGIT and on Wattnet’s real-time environmental data, and point towards a future where sustainability metrics are a native part of how research infrastructures schedule and report on their computing activity, not an afterthought bolted on once the job is already done.
These capabilities are also built to grow with the AI4EOSC ecosystem itself. As new EU-funded projects extend the platform under the AI4EOSC initiative, among them FLUID-AI, EOSC-ARENA, and EOSC-GenAI4Earth, GreenDirector and per-deployment energy monitoring provide a common environmental layer that these projects can build on, rather than having to solve energy-aware scheduling and reporting on their own.